
One of the biggest reasons Shopify store growth stalls out — merchants are guessing.
Facebook shows 200 conversions. Google Analytics shows 400. And your actual sales sit at 470. Which analytics tool is miscalculating? Which one is spot on? More importantly — how are you supposed to know which channel deserves more of your marketing dollars?
The first step to answering these questions is assembling the right analytics stack. Here are the key categories of Shopify analytics tools you should be looking at if you want to unify your data and get accurate views of the impact your marketing touchpoints have on sales (and 5 specific tools to consider).
Shopify’s native analytics capabilities
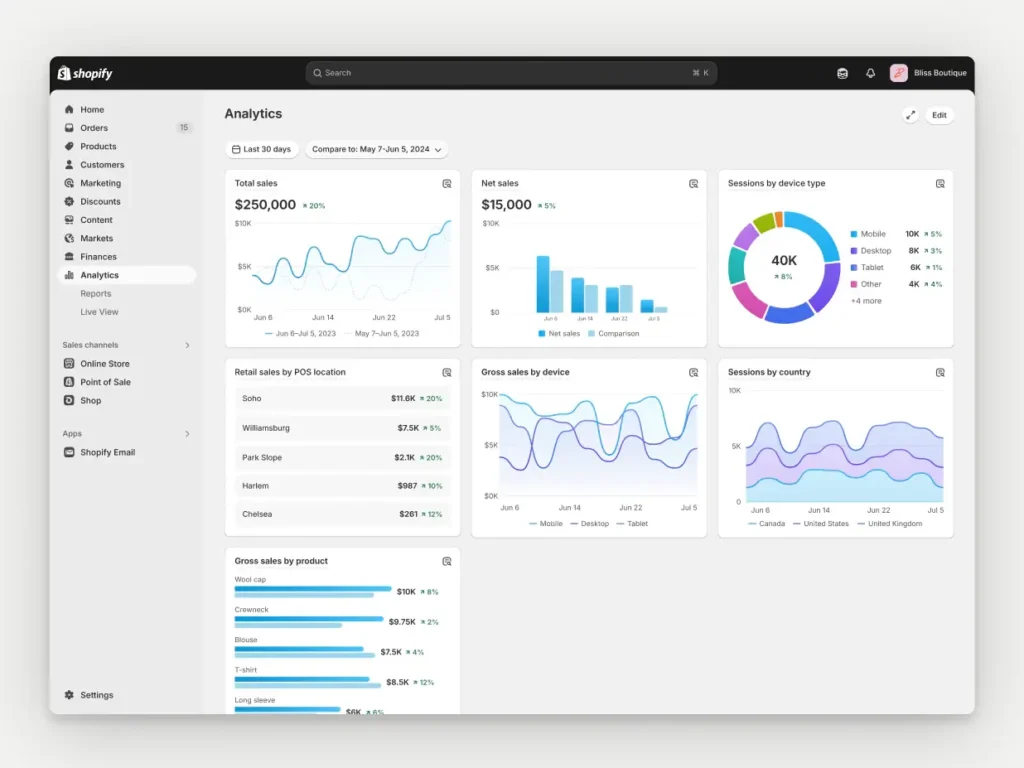
Shopify’s native analytics tools are available to anyone running a Shopify store. These native reports are a great starting point for understanding store performance—especially when you’re just getting off the ground. But for most growing brands, they’re not enough. All plans offer:
- Sales performance: Total sales, revenue, refunds, average order value
- Customer insights: New vs. returning customers, repeat purchase rate
- Traffic metrics: Sessions, page views, top traffic sources
- Product analytics: Product views, conversions, top-selling SKUs
- Basic funnel data: Store conversion rate, cart abandonment
There are additional capabilities for Advanced Shopify or Shopify Plus users like custom report creation and deeper filtering options. However, while there’s value in the free, centralized, out-of-the-box Shopify analytics, the native capabilities fall short when you need:
- Cross-channel attribution: Shopify generally uses a last-click model and doesn’t track touchpoints across multiple platforms (like Meta, Google, or email). There’s no way to see which campaigns actually influenced a sale—only the last known referrer.
- Marketing insights: You can’t track campaign ROI or see spend vs. revenue by channel because data integration options are limited to individual integrations with tools like Google Analytics 4.
- Segmentation and customization: Even with custom reports on higher tiers, you won’t get deep cohort analysis, granular filtering (like behavior by UTM), or the ability to isolate data by marketing intent. It’s more descriptive than diagnostic.
- More attribution modeling: There’s no way to apply first-touch, time-decay, or custom models to better reflect your customer journey. And you can’t exclude spam or bot traffic, which can skew results.
If you want more powerful and precise data, there are a few main categories of Shopify analytics apps you should look at for your stack:
- Multi-touch attribution tools
- Customer analytics platforms
- Website behavior analytics
- Advanced E-Commerce analytics tools
Multi-touch attribution
Multi-touch attribution (MTA) is the practice of tracking every touchpoint a customer engages with on their path to purchase—not just the final one. Instead of giving 100% credit to the last ad someone clicked like first or last-touch attribution, or other models like marketing mix modeling which don’t quite provide granular insight, MTA shows you how all your marketing efforts work together to drive conversions.
When you can see how each channel contributes to the customer journey, a few important things happen to help you optimize performance:
- You allocate budget more effectively, funding the touchpoints that actually influence conversions.
- You reduce wasted resources by identifying campaigns that don’t move the needle.
- You improve creative and targeting based on which messages resonate at each stage.
- You understand time-to-purchase and LTV by source, helping you forecast and scale with confidence.
Without multi-touch attribution, you miss key parts of that story. And that’s why a good tool for MTA is the foundation of a solid Shopify analytics stack.
The Attribution Platform
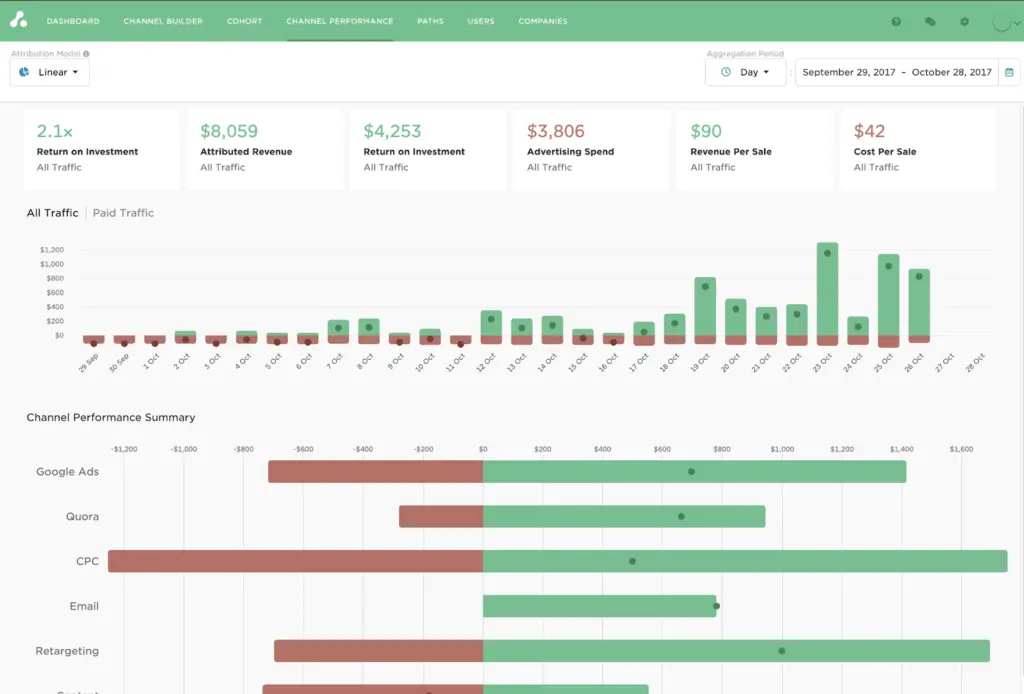
The Attribution Platform connects each sale to every touchpoint and every dollar spent
Instead of relying on black-box data from Google Analytics, Attribution uses clean, deterministic customer data (e.g. from direct ad platform integrations and a Shopify Segment integration or other CDP connections) to show every step in the journey—and lets you audit it down to the conversion path.
Unlike tools that just show proportional credit, Attribution factors in cost, so you’re not just guessing at ROAS—you’re calculating it. You can customize your attribution model to match your strategy, weighing each channel by cost, influence, or any other factor that matters to your business.
There are three areas where Attribution’s Shopify integration makes the biggest difference for analytics:
- Connect ad spend to actual sales: The platform pulls cost data from your ad platforms (Meta, Google, TikTok, and others) and overlays it with conversion data from Shopify. You get a clear view of your return on ad spend (ROAS), not just by channel, but down to the specific campaign, creative, or keyword so you can see which ads drive purchases, cut wasted spend, and double down on what works.
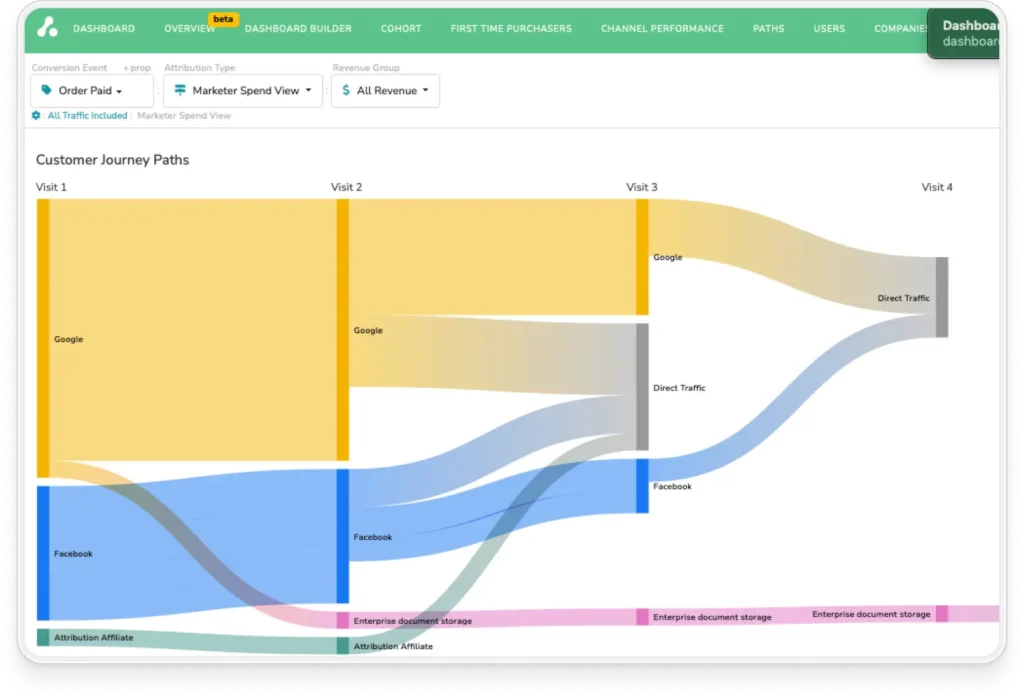
- Get a complete view of the customer journey: One of Attribution’s biggest strengths is its ability to track both online and offline touchpoints. If a customer hears about your brand on a podcast, clicks a Facebook ad, signs up through an email, then converts after a call with your sales team—Attribution captures all of it. That unified view helps you understand how each channel works together, not in isolation.
- See unified, real-time reporting: Attribution replaces the need to stitch together ad dashboards, Shopify exports, and spreadsheet models. Its real-time dashboards give you channel-level ROAS, campaign and cohort performance, individual buyer journeys, and time-to-conversion insights.
Attribution replaces guesswork with clarity. For brands serious about growing efficiently, it’s not just an analytics add-on—it’s the foundation of a smarter marketing strategy.
Book a Demo
Understand the precise impact of each marketing touchpoint and track “true” CAC, ROAS, and ROI on marketing spend with The Attribution Platform.
Customer analytics platforms
Customer analytics platforms are built to help you understand the people behind the purchases. Where attribution tools focus on how channels perform, customer analytics tools reveal who your most valuable customers are, what they buy, and how they behave over time.
These tools analyze order history, browsing behavior, email engagement, and more to surface patterns that help you drive growth. You can see which customers are most likely to come back, which segments are dropping off, and which campaigns drive loyalty—not just clicks.
For Shopify merchants, these tools are essential for:
- Identifying high-value customers based on real purchase and engagement behavior
- Building smart segments to personalize email, SMS, and ad campaigns
- Spotting churn risks early and triggering targeted retention efforts
- Measuring LTV by source or campaign to align acquisition with long-term ROI
- Understanding repeat purchase patterns to better time and tailor re-engagement
Customer analytics tools are the link between performance data and action. They help you understand who is driving your revenue and how to build more durable, profitable relationships.
Two popular tools in this category are Klaviyo and Omnisend—both built to integrate seamlessly with Shopify and give merchants a clearer picture of their customers. We’ll break each down in more detail next.
Klaviyo
Klaviyo is best known as an email and SMS marketing platform, but for Shopify merchants, it also doubles as a powerful customer analytics tool. Beyond just sending campaigns, it helps brands understand their customers, segment their audience, and personalize marketing based on real purchase and engagement data.
What it does well
Klaviyo connects directly with your Shopify store to sync purchase history, browsing behavior, product views, and engagement data. That connection gives you a running feed of customer activity, which powers smart segmentation and automation.
You can group customers based on:
- First vs. repeat purchase behavior
- Product categories bought
- Time since last order
- Email or SMS engagement history
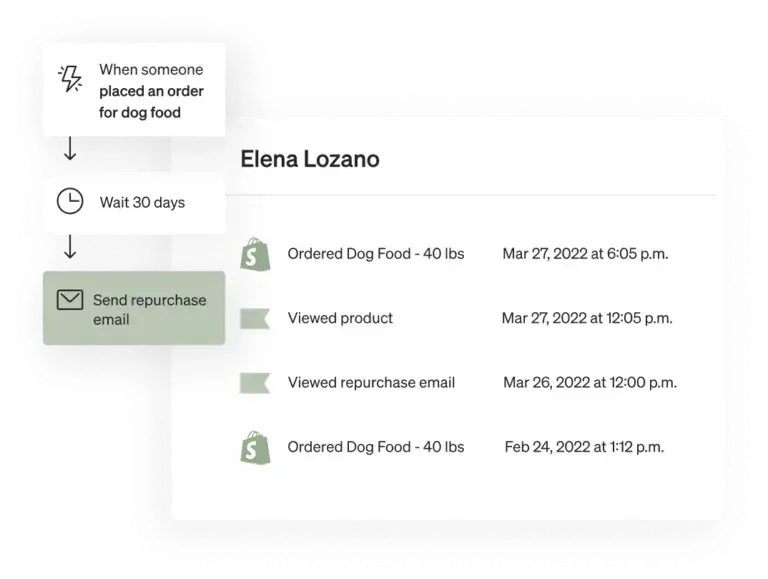
Klaviyo also offers predictive analytics, using machine learning to estimate customer lifetime value (LTV), likelihood to churn, and expected next order date. These insights make it easier to tailor campaigns to high-potential customers—or re-engage segments before they drop off.
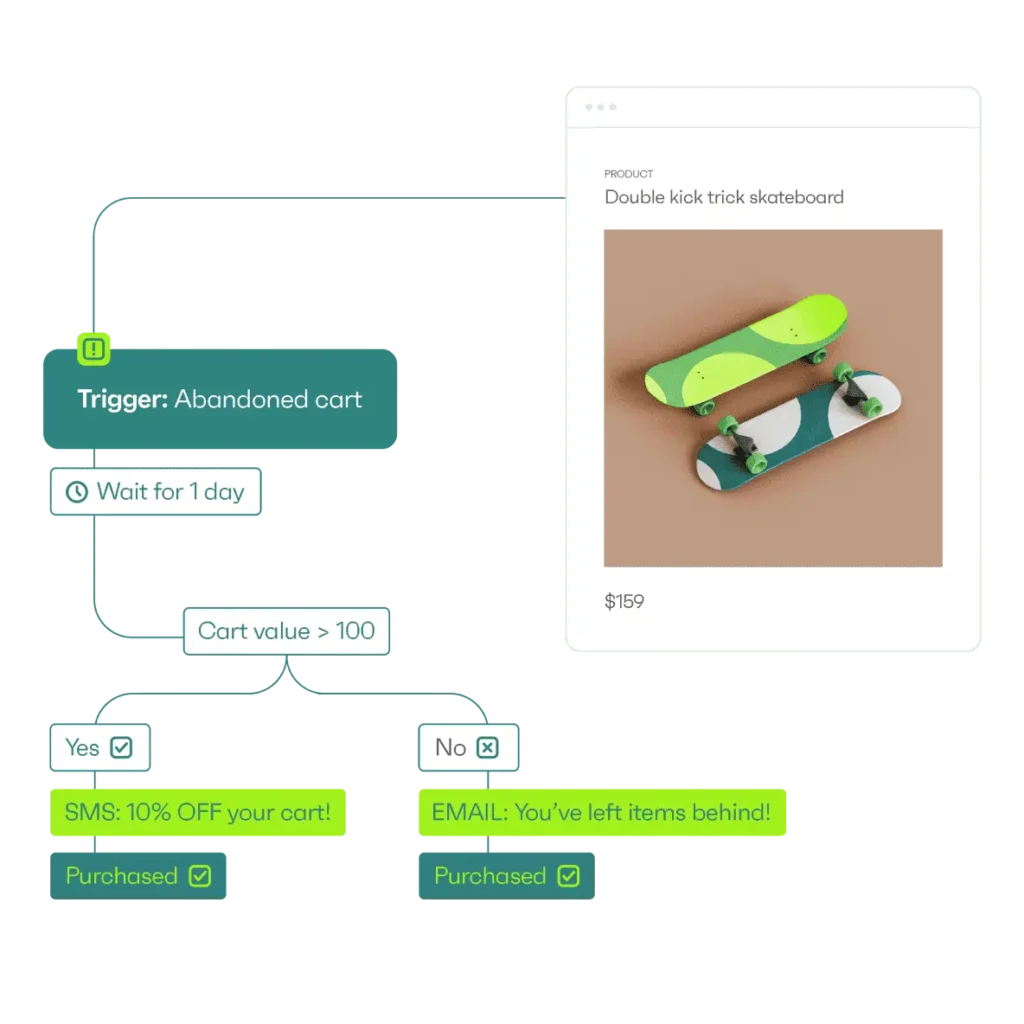
Its automation features are directly informed by this customer data. You can trigger flows for abandoned cart emails, post-purchase follow-ups, reactivation campaigns, or VIP offers—all based on how someone has interacted with your store.
Because Klaviyo tracks revenue attributed to each campaign or flow, you can measure exactly how customer engagement is impacting your bottom line—not just open or click rates.
Where it falls short
While Klaviyo offers strong customer insights, its focus is still primarily on messaging. It doesn’t track full multi-touch journeys or marketing spend, so you won’t get channel-level ROAS or attribution across platforms. Its analytics are deep when it comes to behavior within your owned channels (email, SMS, website), but limited when it comes to paid media or top-of-funnel activity.
It also assumes your engagement strategy lives within Klaviyo. If your team relies heavily on paid ads, influencer campaigns, or offline experiences, Klaviyo’s insights may only cover part of the picture.
Omnisend
Omnisend is a marketing automation platform built for E-commerce, with a strong emphasis on email and SMS—but like Klaviyo, it also includes robust customer analytics features. For Shopify merchants looking to better understand their audience and drive more personalized engagement, Omnisend offers an approachable, all-in-one solution.
What it does well
Omnisend integrates directly with Shopify to sync customer data in real time. That includes order history, browsing behavior, product preferences, and engagement with past messages. This data fuels its built-in segmentation and automation tools, allowing merchants to tailor messages to the right people at the right time.
You can easily segment your audience by:
- Purchase frequency and recency
- Product type or category
- Engagement with past emails or SMS
- Total revenue or average order value
Omnisend also offers pre-built automation workflows for common E-Commerce use cases like welcome series, abandoned cart, win-back campaigns, and product recommendations—all customizable based on customer behavior and Shopify data.
Its reporting dashboards tie engagement metrics back to revenue, so you can see which campaigns are driving actual sales, not just opens or clicks. This helps brands focus on what’s working and refine messaging over time.
For smaller teams or newer stores, Omnisend’s UI is easy to navigate, and its templates and plug-and-play automations make it faster to get started compared to more complex platforms.
Where it falls short
While Omnisend offers strong tools for customer engagement, its analytics capabilities aren’t as advanced as more specialized platforms. It doesn’t offer predictive LTV modeling, churn forecasts, or deep cohort analysis out of the box.
Its automation and reporting are heavily geared toward email and SMS. If you’re looking for cross-channel attribution or marketing mix insights, you’ll need to pair it with another tool in your analytics stack. And for brands with more complex segmentation needs or larger product catalogs, Omnisend can start to feel limited compared to higher-end platforms.
Website behavior analytics
Website behavior analytics tools help you see what traditional conversion data can’t: how visitors actually experience your Shopify store. While a Shopify Google analytics integration or native Shopify reports tell you what happened—how many people visited, what they bought, or where they bounced—behavior analytics shows you why.
These types of Shopify analytics tools use heatmaps, session recordings, click tracking, and scroll-depth data to visualize how users interact with your site. You can watch real sessions to see where customers hesitate, where they get stuck, and what elements they skip entirely. That kind of visibility is key to improving the user experience—and turning more clicks into conversions.
Website behavior analysis helps you:
- Identify friction points in the browsing and checkout experience
Understand where attention drops off on key landing or product pages - Spot mobile usability issues that impact conversion rates
- Prioritize A/B tests and design changes based on actual behavior
- Uncover gaps between traffic sources and on-site engagement
When used well, these insights can lead directly to better conversion rates. You can simplify your navigation, optimize product pages, test new layouts, or improve mobile performance based on real user behavior—not guesses or assumptions.
One behavior analytics tools that works well with Shopify is Hotjar. Both offer Shopify-friendly integrations and provide valuable qualitative data to round out your analytics stack.
Hotjar

Hotjar is a behavior analytics platform designed to help you visualize how people interact with your Shopify store. Instead of just tracking page views or bounce rates, it shows you exactly where users click, scroll, and drop off—all through real-time heatmaps and session recordings.
What it does well
Hotjar makes it easy to see what’s working (and what’s not) in your site experience. With heatmaps, you can identify which areas of a page attract the most attention—and which get ignored. Session recordings let you watch real customer journeys, helping you spot confusing navigation, broken elements, or hesitation in the buying process.
For Shopify merchants, this kind of insight is especially useful for reducing checkout abandonment. You can watch sessions where customers added products to their cart but didn’t buy, and look for patterns: did they get stuck on a shipping step? Did a form field glitch out on mobile? Are visitors clicking where they expect something to happen—but nothing does?
These findings can inform quick fixes that make a big impact. For example:
- Moving a “Buy Now” button higher on the page
- Simplifying your cart flow
- Fixing distracting layout issues on mobile
These might seem like small tweaks, but when they’re based on real behavior, they often result in meaningful lifts in conversion rates.
Where it falls short
While it’s easy to use, it can be time-consuming to sift through session recordings without a clear idea of what you’re looking for. It’s most effective when paired with other data points that help you prioritize where to focus.
Advanced E-Commerce analytics
Advanced E-Commerce analytics platforms go beyond basic reporting to explain why certain products perform better, which ones are draining inventory, or how merchandising decisions impact your bottom line.
These tools track retail-specific metrics like product-level profitability, inventory velocity, discount impact, SKU bundling performance, and margin by channel. For growing Shopify brands, this level of insight is essential to making smarter decisions about what to sell, how to price it, and when to restock.
One standout platform in this category is Glew.io. It integrates with Shopify and dozens of marketing tools to provide insights like:
- Which products drive the most repeat purchases
- How bundling or upselling affects average order value
- How seasonal trends impact inventory planning
- What product combinations lead to higher LTV customers
Glew.io
Glew.io is an advanced E-Commerce analytics platform designed to help Shopify merchants dig deeper into product performance, inventory insights, and customer behavior. It goes well beyond surface-level metrics to give you a full picture of what’s driving—or draining—your profitability.
What it does well
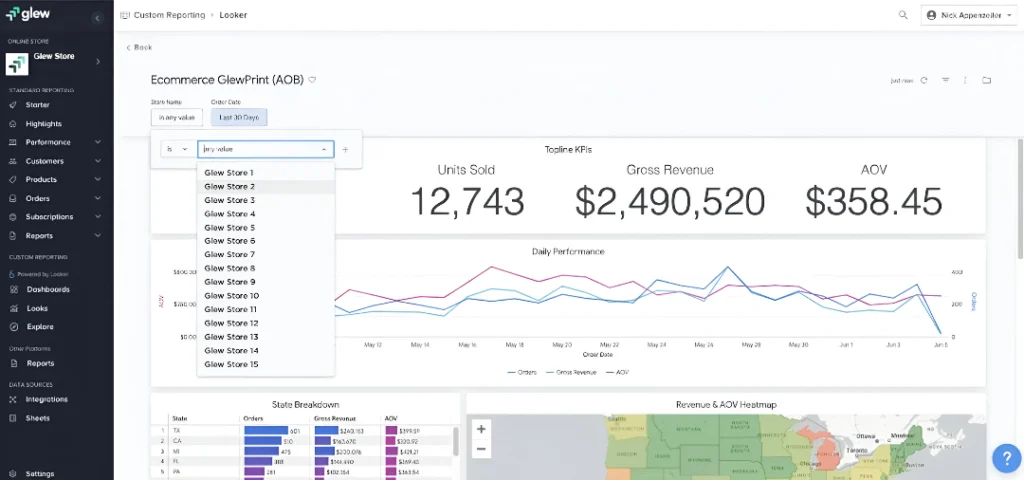
Glew.io connects directly to your Shopify store, pulling in order data, product catalog details, customer history, and marketing performance. Once integrated, it delivers automated reports that give you clarity across your entire operation—from inventory to lifetime value.
Glew offers three core advantages:
- Product-level analytics: See which SKUs are the most profitable (not just top-selling), how discounting affects margins, and how inventory trends align with demand.
- Custom cohort analysis: Group customers based on first purchase date, acquisition source, product category, or other traits—and then track how those cohorts behave over time.
- Repeat purchase behavior analysis: Know which campaigns or products bring in customers who stick around—not just convert once.
Where it falls short
Glew is a powerful tool, but it’s built for brands that are ready to get granular. For smaller stores or teams without a strong handle on data, it can feel overwhelming at first.
Pricing also scales based on data volume, so merchants with large catalogs or high order volume may see costs rise quickly. Some advanced features—like full forecasting and custom reporting—are gated behind higher-tier plans.
How to build your Shopify analytics stack
With so many Shopify analytics tools available, it’s easy to either overcomplicate your setup or end up with disconnected systems that don’t talk to each other.
The key is building your analytics stack with purpose—starting with the right foundation and layering tools based on your stage of growth.
Start with your current needs and complexity
Before jumping into tools, take stock of what kind of data you actually need to grow. A small team running two or three paid channels doesn’t need the same setup as a 20-person growth team managing omnichannel campaigns and inventory at scale.
Ask yourself:
- How many channels are we investing in?
- How long is our sales cycle?
- Do we sell primarily DTC, B2B, subscriptions, or in-person?
- How often do we need to report on performance?
- Who on the team will be using the data—marketers, ops, finance, execs?
This helps you map out the right starting point, without paying for tools you don’t need or creating unnecessary complexity.
Build your stack in layers
You don’t need to implement everything at once. A strong Shopify analytics stack comes together in phases:
- Start with customer data: Platforms like Klaviyo or Omnisend give you a hub for customer data, helping you segment based on behavior and build personalized outreach campaigns that drive sales and build loyalty. When your channel mix and segmentation become increasingly complex, you’ll want to implement a CDP like Segment to better aggregate your data.
- Add Attribution: Attribution should be the foundation of your Shopify analytics stack once you have campaigns up and running. It ties all your channels together, connects spend to revenue, and gives you a clear view of what’s actually driving growth. Without this layer, every other tool is reporting in a silo.
- Incorporate behavior analytics: Tools like Hotjar help you understand how customers interact with your site—and where friction might be killing conversions.
- Integrate product and inventory analytics: For brands with large catalogs or operational complexity, tools like Glew.io give you a deeper view of profitability and inventory trends to support better forecasting and merchandising.
- Layer on retention and LTV insights: As you scale, use tools like RetentionX to optimize for long-term value. This helps you refine retention strategies and plan acquisition more efficiently.
Don’t ignore practical constraints
Be realistic about:
- Budget: Some platforms price based on order volume, data sync frequency, or features. Know what’s included—and what’s gated behind a higher tier.
- Technical skills: Tools with advanced customization or modeling features may require setup support. Choose tools your team can actually use.
- Team bandwidth: A powerful dashboard isn’t helpful if no one has time to maintain it. Automate where you can, and prioritize platforms that surface actionable insights out of the box.
Mind the integration considerations
The best analytics stack isn’t just a collection of tools—it’s a system. That only works when data flows cleanly between platforms.
Integrations are how that happens. Most modern analytics tools offer one or more of the following methods to connect with Shopify and each other:
- Native Shopify apps: Easy to install and designed to sync key data like orders, customers, and products in real time.
- Third-party connectors (e.g., Segment, Zapier, or Make): Useful for passing data across tools that don’t have direct integrations.
- Custom APIs: Great for flexibility, but require dev resources and ongoing maintenance.
Regardless of method, the goal is the same: ensure your marketing, product, and customer data flows into a shared source of truth—without manual exports or inconsistencies.
This is another reason to put Attribution at the core of your analytics stack. As a central hub, it helps unify spend, revenue, and journey data across platforms. That makes every other report—from Klaviyo to Glew.io—more accurate and actionable.
When your stack is integrated well, each new tool doesn’t create more work—it just adds more value.
Shopify analytics tools FAQs
Why not rely solely on Shopify’s built-in analytics?
Shopify’s native analytics are great for tracking basic sales and traffic, but they don’t show how different marketing channels work together to drive revenue. You’re missing key insights around attribution, customer behavior, and long-term value—all of which are essential for making smarter growth decisions.
How do I measure ROI across all my marketing channels for my Shopify store?
To measure true ROI, you need a tool that connects your ad spend to actual purchases—across every touchpoint. Multi-touch attribution platforms like Attribution unify cost and conversion data so you can see what’s driving results, not just clicks.
What metrics should Shopify store owners track beyond basic sales data?
Beyond revenue and orders, it’s important to track customer lifetime value, repeat purchase rate, channel-level ROAS, and product-level profitability. These metrics help you understand which campaigns bring in the best customers and where to focus your budget.
How can I connect my offline marketing to my Shopify analytics?
Use an attribution tool that supports both online and offline touchpoints—like direct mail, events, or sales calls. When integrated properly, these can be tied to Shopify orders and tracked alongside your digital efforts for a full view of what’s driving conversions.