
Ever heard of the phrase “tipping point?” In marketing, two key moments—the first spark that grabs a prospect’s attention and the final nudge that seals the deal—can tip someone into conversion.
Position-based attribution hones in on this critical juncture, i.e., decisive moments or interactions by giving extra weight to the first and last touchpoints, while still acknowledging the supporting role of everything in between.
In this article, we’ll break down how this U-shaped model works, explore its pros and cons, and show you why tracking every cost and interaction can sharpen your strategy and boost results.
Key Takeaways:
- Position-based attribution cuts through the clutter by looking at that first spark and final push.
- This model forces you to confront which interactions truly pack a punch, i.e., drive conversion action, balancing key bookend moments with the supporting middle, so you can allocate your budget where it matters most.
- But don’t get complacent—position-based attribution is only as powerful as the data behind it.
What Is Position-Based Attribution?
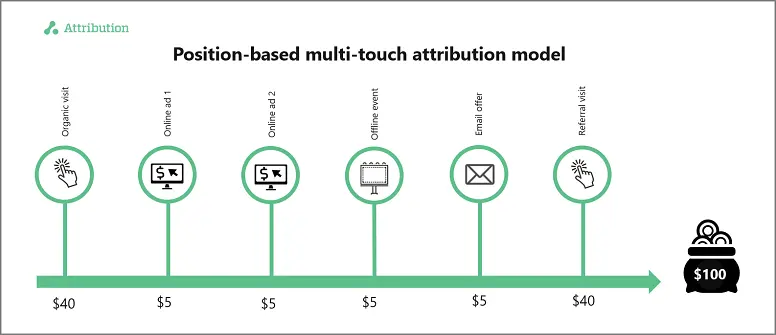
Position-based attribution is a marketing attribution model that distributes the majority of conversion credit to the first and last touchpoints in a buyer’s journey. It usually assigns 40% of the credit to the first touch, 40% to the last touch, and then splits the remaining 20% among any other interactions that occurred in between.
This is why it’s also referred to as a “U-shaped attribution model:” It places greater emphasis on the endpoints (the first and final touches) while still recognizing the middle touches, albeit with less weight.
Think of it like a storyline: you care a lot about how the story begins (your prospect’s initial introduction to your brand) and how it ends (the moment of purchase or conversion). The middle chapters are still important for building momentum, but the opening and closing scenes get the spotlight. Essentially, position-based attribution tries to capture this nuance.
Why Should Marketers Care About Position-Based Attribution?
Marketing today means juggling a hundred campaigns—from building brand buzz and generating leads to keeping your existing customers coming back. With so many moving parts, it’s easy to lose track of which channels and marketing efforts are really driving conversions.
That’s where a smart attribution model like position-based attribution comes in, letting you ditch the guesswork and make data-driven decisions.
Key Benefits:
- Spotlights Critical Touchpoints: It gives extra credit to the first interaction that grabs attention and the final nudge that closes the deal, showing you just how crucial those moments are.
- Values the In-Between: While the first and last interactions get the lion’s share of credit, the middle touches still matter—ensuring you don’t overlook the steps that help nudge a prospect down the funnel.
- Offers a Straightforward Multi-Touch View: It’s a simple way to move beyond just first-touch or last-touch models, without the complexity of advanced, algorithmic attribution—particularly relevant in B2B multi-touch attribution with longer sales cycles.
These are just a few of the reasons why position-based attribution can help you get a clearer picture of what really moves the needle in your marketing strategy.
How Does Position-Based Attribution Work?
Position-based attribution—key to revenue attribution—splits conversion credit across the customer journey by assigning weight to key touchpoints—often with a typical split of 40% for the first touchpoint, 40% for the final push, and 20% for everything in between, though you can adjust these numbers based on your needs.
- Capture All Touchpoints: Start by tracking every interaction your prospect has with your brand. Integrate data from your ad platforms (like Google Ads, Facebook Ads, or LinkedIn Ads) with your customer data platform (CDP) to map the entire journey, ensuring you collect solid, deterministic data.
- Identify the First and Last Interactions: Once you have the full timeline, pinpoint which channel first introduced your brand and which one delivered the final nudge to conversion—these usually grab around 40% of the credit each.
- Calculate the Middle Touches: Distribute the remaining credit—often around 20%—across all interactions that occur between the first and last touches. For example, if a user clicks an email link and later interacts with a retargeting ad, these actions share the remaining credit.
- Assign Cost Data to Each Touchpoint: It’s crucial to link each interaction to its cost. By combining your ad spend with conversion data, you can see which campaigns generate profitable engagements and which don’t.
- Analyze and Optimize: With a complete picture of various touchpoints and their associated costs, you can assess which marketing channels truly drive conversions. If expensive top-of-funnel ads rarely lead to conversions, you might adjust your spend, while low-cost nurture emails that consistently push users closer to conversion could warrant more investment.
Let’s look at an example: Sarah’s a busy professional who loves staying active. One morning, while scrolling through Instagram, she comes across a sleek ad for a new smartwatch promising to help her hit her fitness goals. Intrigued, she visits the brand’s website but doesn’t buy anything right away.

A couple of days later, she receives a friendly email (from your company) offering her an exclusive discount on that very smartwatch. Still mulling it over, she later catches a quick, engaging product review on YouTube that makes her picture the device on your wrist. Or, while reading the news on her favorite app, a retargeting ad reminds you of the smartwatch, and she clicks through to make her purchase.
In a position-based attribution model, your brand might give 40% of the credit to that first Instagram ad, another 40% to the final retargeting ad, and 20% to the nurturing email and YouTube video combined—so you can see that Sarah’s journey began with Instagram, but every step played a role in turning curiosity into a sale.
What Are The Drawbacks of Position-Based Attribution?
Position-based attribution is a step up from single-touch models because it balances the credit between the first and last interactions in a customer’s journey.
However, this approach can overvalue those “bookend” touchpoints while downplaying the vital middle interactions that nurture leads along the way. In marketing campaigns with many touchpoints, that leftover 20% of credit gets spread too thin, and for shorter journeys, simpler attribution models like last-click might actually offer clearer insights.
On top of that, position-based attribution demands a robust tracking system and comprehensive data collection—something that can be a tall order for businesses with limited analytics infrastructure, like Google analytics alone. It also doesn’t factor in nuances like recency or decay, treating every middle interaction the same regardless of timing or influence.
These shortcomings make it essential to use position-based attribution alongside other models to truly capture the full picture of your marketing performance.
When Does It Make Sense To Use Position-Based Attribution?
Position-based attribution shines when your marketing funnel has multiple key touchpoints but doesn’t require the complexity of advanced AI. It’s ideal if:
- Your Funnel Is Multi-Step Yet Manageable: If your campaigns include social ads, blog posts, emails, and a final paid search ad, this model offers a balanced view without the need for heavy data science.
- You’re Handling Lower-Cost Transactions: For more affordable products, assigning 40% credit to both the first and last interactions quickly reveals what grabs attention and what seals the deal while still giving some credit to the nurturing steps in between.
- Your Sales Cycle Is Short to Medium: When your customer journey spans a few weeks rather than several months, focusing on the start and end points makes sense; longer cycles might call for a more nuanced approach.

For instance, imagine a small e-commerce store selling mid-range consumer electronics. A typical customer might first discover the brand through a Facebook ad, browse the website, check out reviews, sign up for an email newsletter, and finally return via a Google Shopping link to purchase.
In this scenario, a position-based ecommerce attribution model would credit the initial Facebook ad for introducing the brand and the Google Shopping link for closing the sale while still recognizing the valuable role of the email interactions. This balanced approach works well because the funnel isn’t overly complex, yet each major step influences the final decision-making.
If Not Position-Based Attribution, Then What?
No single model works for every business. Some marketers stick with linear attribution models, splitting credit evenly across touchpoints, while others rely on data-driven models that adjust based on performance. But here’s the problem—standard models like position-based, first-touch, last-touch, or linear often miss the bigger picture. They don’t factor in cost data, and they rarely give you a true, user-level view of what’s driving the conversion rate.
That’s why many marketers turn to custom attribution models, especially multi-touch attribution models. Instead of being locked into a fixed split, you can assign credit based on what actually moves the needle—whether that’s a mid-funnel webinar that changes minds or a retargeting ad that consistently delivers high-value leads. And when you layer in cost data, you don’t just see what’s working—you see what’s working profitably.
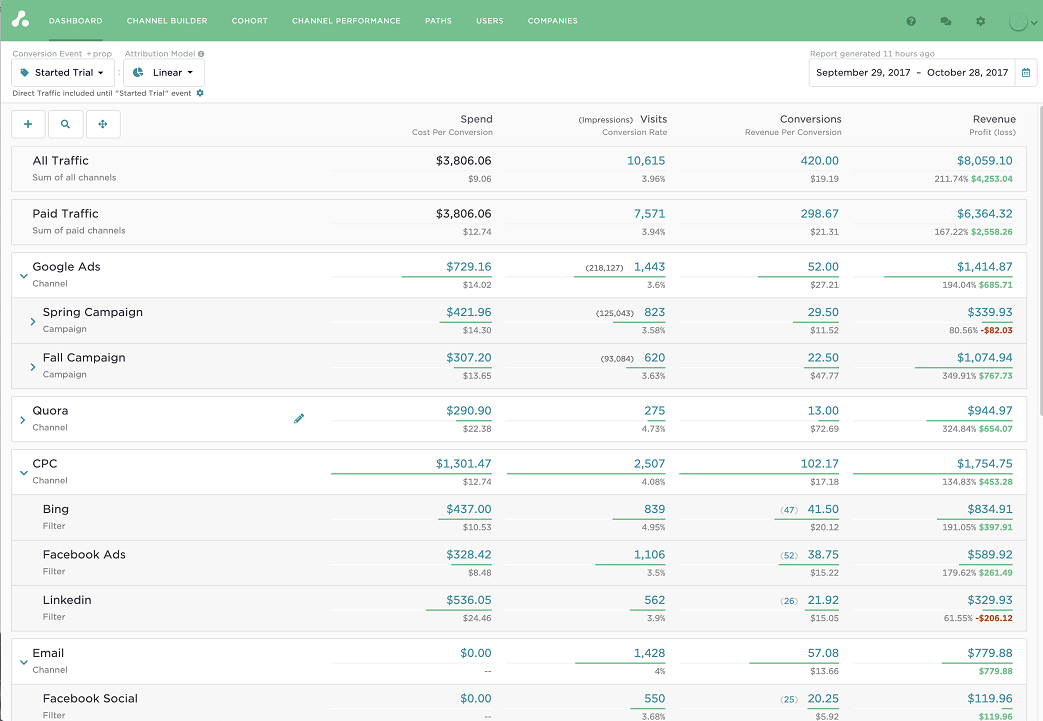
Sign up and try Attribution today — pinpoint CAC by channel, audit funnels and conversion rates, scale revenue-driven content marketing, measure affiliate LTV and CAC (and more).
Position-Based Attribution FAQs
What is an example of a position-based attribution model?
A common example is the U-shaped model, where you assign 40% of the conversion credit to the first interaction and another 40% to the final interaction, with the remaining 20% shared among the middle steps.
Let’s take an example when a conversion is attributed to social media, email, and PPC. If a customer first clicks on a sponsored social media post, later subscribes to an email campaign, and finally converts via a Google Ads click, then both social media and Google ad would each get 40% of the credit, while the email campaign earns the remaining 20%.
How does the position-based attribution model assign credit to clicks?
Position-based attribution gives the bulk of the credit to the bookends of the customer journey—the initial click that hooks the prospect and the final click that seals the deal—while the interactions in between share a smaller slice of the pie.
You can adjust these percentages to match your business model, but the key is to set clear, transparent rules and track cost data so you’re measuring real ROI, not just click counts.
How does position-based attribution differ from other attribution models?
Unlike first-touch attribution models that only credit the initial interaction or last-touch attribution models that focus solely on the final click, position-based attribution weighs both the first and last interactions heavily, with a modest share for the middle touches.
This contrasts with linear attribution, which splits credit equally, time-decay attribution models that favor recent touches, and data-driven models that use machine learning to determine impact.
Position-based (U-shaped) is often seen as a middle ground—more nuanced than first- or last-touch, but simpler than fully data-driven models. It still gives primary credit to pivotal touchpoints, while recognizing the entire journey.
Keep in mind, though, that any model can miss the mark if it doesn’t incorporate real costs, rely on transparent user-level data, and allow for customization.